

Robust reports for your survey data
Features for you: Cross-tabs Create segments Data exports
Providing free online surveys for some of the best


Grow your business with data-driven insights
Make the most of your data with a powerful, professional survey results report.
Real-time data
As soon as a respondent hits 'Submit', you can analyze data to make informed decisions.
Multiple reports
Create unlimited reports based on your data set, each with their own view of the data.
Work together
Invite your colleagues to your team dig into your survey data together.
Identify patterns and trends
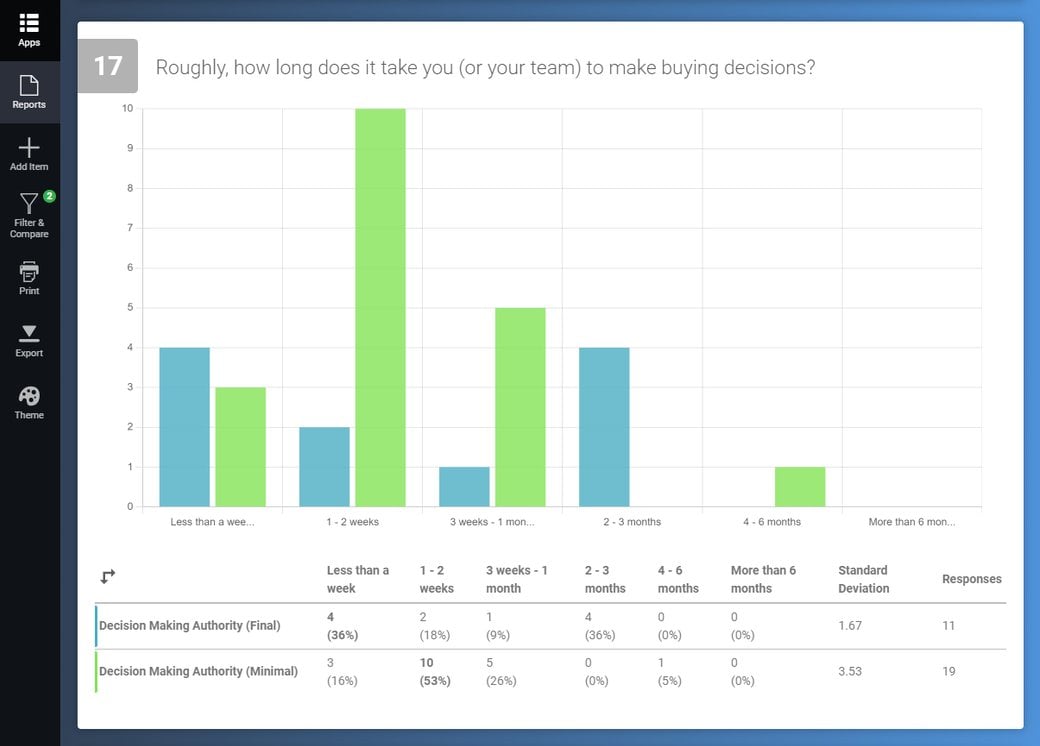
Filter your survey results report by question, date, CRM groups, email metrics, and more to learn as much as you can about your respondents.
Go beyond the who and what to find out the why with advanced cross-tabulation. Compare sets of data using two or more filters to get more detailed views of your results.
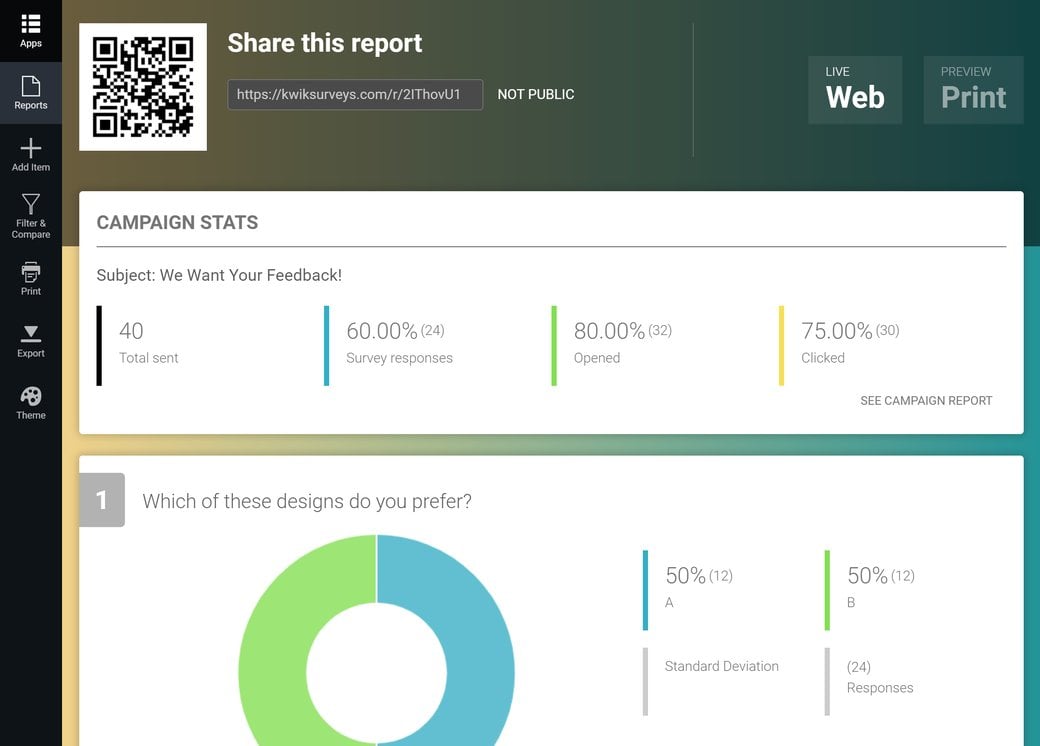
Track email engagement data
When sharing your survey via email invitations, all engagement metrics associated with that campaign will be available in your survey report.
Run multiple email invitation campaigns for the same survey, and access the full report for each from the same place.
Easily identify which CRM contacts opened emails, clicked links, and responded to your survey.
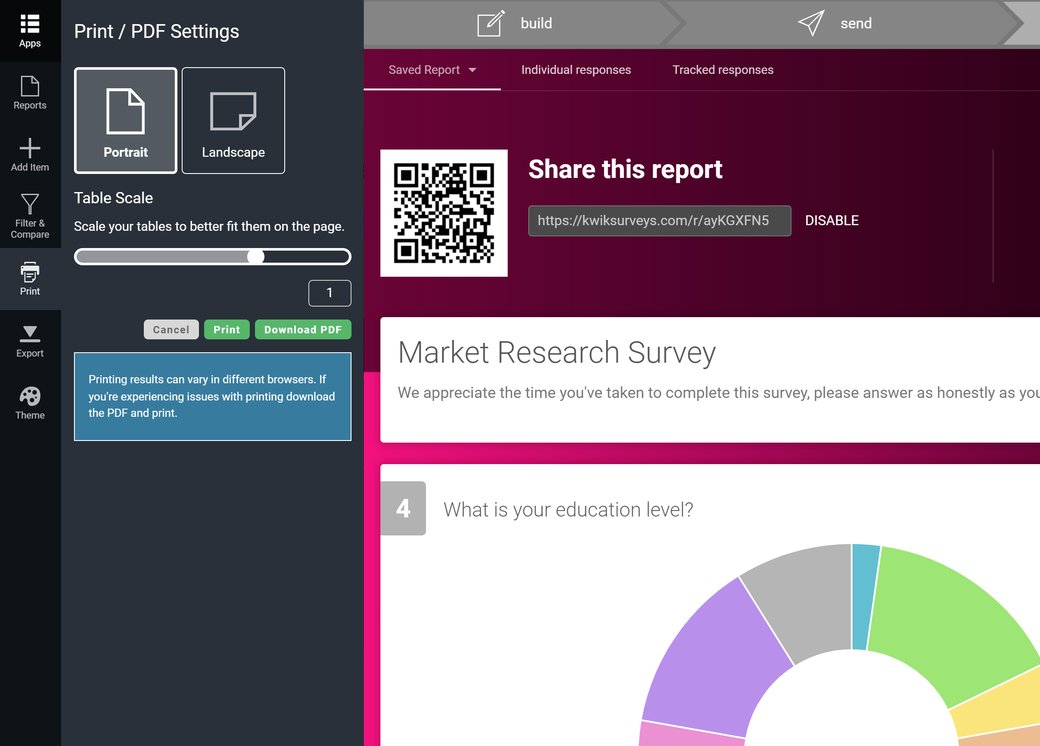
Effortlessly export your reports
Export offline copies of your results as a PDF or XLSX spreadsheet. PDFs contain all the charts and graphs we generate for your report. Whereas spreadsheets provide tabs for compiled results and individual responses.
Make your digital report accessible with a URL link, which you can share with team members and other stakeholders who’re interested in your findings.
What our customers say about us


Report FAQs
Can I share access to reports?
You can share access to your reports with a URL link. This link is not active by default, you need to make your report accessible from the Results section of your project.
Can I create multiple reports for the same data set?
Yes, you can create new reports for the same dataset and pick and choose which questions to include in the additional report. You can even duplicate your existing report to save specific views you create using Filters and Comparisons.
What filters can I apply to in reports?
At FreeOnlineSurveys, we offer a huge range of filters you can use to segment and compare data in your report. Here’s a full list of those filters:
- Fields: Filter or compare survey data and email metrics based on default fields or custom fields you create for contacts.
- Group: Filter and compare data according to contact groups.
- Unsubscribed: Filter or compare data based on whether contacts are still subscribed to the CRM.
- Source: Filter and compare data based on the source from which contacts were imported to the CRM.
- Sign-up date: Filter and compare survey data and email metrics based on the data contacts subscribed to your list.
- Campaigns: Filter and compare data based on how contacts engaged with email campaigns.
- Statistics: Filter and compare survey responses based on contact’s averaged email engagement metrics.
- Survey question: Filter or compare based on answer selections for survey questions.
- Formula result: Filter responses based on the results received in a calculator (Calculators only).
- Survey completion: Choose to filter by or compare Complete and Incomplete responses.
- Survey response date: Filter or compare data based on response dates.
- Survey response country: Filter or compare based on respondent locations.
Can I switch between different charts and graphs?
Most question types will allow you to switch between the below charts and graphs:
- Doughnut Chart
- Line Graph
- Column Graph
- Radar Chart
- Pie Chart
- Star Rating
- Rankings
Some question types, such as Net Promoter Score, will have a specific chart displayed by default. We believe these to be the best ways to visualise your data, but you’re welcome to change those if you feel your data is better suited to another format.
Can I customize report designs?
You can set a colour gradient for your report background, which will be visible if anyone accesses your Results or your publicly accessible digital report. These backgrounds are not exported in the PDF.
You can also add images, videos, headings and sections of text to your report to add more context to data.
Can I group or hide answer options?
Yes, you’re able to both Group and Hide answer options in your report.
Grouping answer options allows you to merge the data for two separate answers into one. For example, image that you have a satisfaction question with the following answer options:
- Very Dissatisfied
- Dissatisfied
- Neutral
- Satisfied
- Very Satisfied
You might want to group the positive and negative answer options to create a different view of your data. So, your answer options could be grouped as below:
- Dissatisfied (containing both Very Dissatisfied and Dissatisfied)
- Neutral
- Satisfied (containing both Very Satisfied and Satisfied)
You can edit the label for these answer options to name them anything, e.g. “Positive”, “Neutral”, and “Negative”.
Hiding answer options allows you to remove an answer option from your data set temporarily. Your data is not deleted, all you need to do is Show the answer option and it will reappear.
In both of the above cases, charts and graphs will update according to answers you hide and group.
How many responses can I collect?
We try to be as generous as possible with the amount of responses you can collect at FreOnlineSurveys. With both the Free and Monthly plans, you can collect up to 1000 responses.
All our other plans (Essentials, Professional, and Business), allow you to collect unlimited responses.
Can my team members view my reports?
If you’re part of an Organization on FreeOnlineSurveys, none of your team members will have access to your reports without your say so. All dashboards are private by default, they will only be able to access your reports if you invite them to collaborate on the project.